Which Indoor Air Quality Monitors Are Best And Why

Updated 11/20/17 as noted.
We’ve all seen the studies: Our Indoor Air Quality is terrible! It’s KILLING MILLIONS!!
The problem with these studies is that if you’re like me you thought; “great, another scare tactic.” Or “it’s really only a problem in Asia.” Or of course, “Indoor Air Quality (IAQ) may be a problem in someone else’s house, but not mine.” Even if you’ve read that poor IAQ is being found to be a cause of childhood asthma and mental illness, or that air pollution is the single largest environmental health risk according to the World Health Organization, it still feels too remote to worry about it.
To further enforce the disconnect, short of a government study, there has been no clear way for the average person could gain even the vaguest insight into their indoor air quality (but here’s a hint, if you use air “fresheners,” you have an IAQ problem.)
Well, that’s all changed, no more guessing. Average Joes like you and me can now get a pretty good picture of how good or bad the air in our homes is, and test what efforts are effective at improving our indoor air quality. This is thanks to a new class of indoor air quality (IAQ) testing devices has recently hit the market in the $150-250 range.
Until now only professional level monitors for dust (PM2.5) and chemical pollution (VOCs) have been available, usually for thousands of dollars.
The new IAQ monitors create new questions. Which new air quality testers are good? Which are best? Which can help us not just understand when things are awry in our homes, but also help us make our homes healthier? Let’s pause for two definitions:
PM2.5 – Particulate matter 2.5 microns and below. It’s very small dust, or particulate matter, that we can inhale. Some of which goes straight into our bloodstreams through our lungs. For reference human hair is about 50-70 microns thick. Exhaust from cars and trucks is a major contributor.
VOCs – Volatile Organic Compounds – If you can smell a chemical, the odds are good it’s a VOC, or chemical pollutant. You can smell them because their vaporization (boiling) points are close to room temperature. Many are highly reactive with other chemicals, often creating other, even nastier ones. Some VOCs you can’t smell. Most we can’t smell at lower levels. They are most prevalent indoors where they can build up. Gasoline, cleaners, and paint are a few products that contain VOCs.
Almost a year ago I posted an article on GreenTech Media that this device revolution was coming. Shortly thereafter I set out to find answers as the monitors began to hit the market. Exciting times! Finally, it looked like there was a way to directly measure and understand the scary stories and statistics I’d heard about indoor air quality (IAQ):
– Mental illness in children has been linked to air pollution.
– Children’s asthma has been causally linked to damp buildings (high humidity).
– 1 in 8 worldwide deaths is caused by air pollution. (World Health Organization)
– PM2.5 is the world’s largest single environmental health risk. (WHO)
– Significant increases of respiratory and heart disease, strokes, and lung cancer. (WHO)
– Don’t go outside. Asia has air quality index (AQI) apps to predict when they can go outdoors. Buildings and cars have special filtration and keep the windows closed. (The US has an AQI website too.)
– 50% of Americans are exposed to unhealthy air. California, the rust belt, and the south generally have the worst Outdoor Air Quality. American Lung Association
– Indoor air is 2 to 5 times as polluted as outdoor air with VOCs. (EPA)
– We spend 90%+ of our time indoors. If there’s bad stuff there, it’s affecting us.
Being an expert in Home Performance (a field that studies the intersection and interconnection of insulation, HVAC, Energy Efficiency, and Indoor Air Quality), I know that indoors and outdoors are very connected, particularly in the nicer months when we open windows while outdoor pollution levels are often highest. Managing the quality of the air we breathe is a problem that needs a solution. And not just in Asia.
By mid-2015 these IAQ devices were looking like they might have the answer to the air quality testing problem, which means they may be useful for helping to reduce those ugly statistics about air pollution.
I started to beg, borrow, and… buy these devices. I first bought Foobot, Awair, NetAtmo, Hobo, and CO Experts devices. Later I was given additional Foobots and a Speck. Dylos and Air Mentor 6 in 1 were loaned to me.
Update: I have also purchased a uHoo and plan to purchase a Purple Air.
After taking so much time to get to know these devices, the information they provide, and how they can be useful for improving lives I decided to put some thought into creating a framework for explaining what makes a really good consumer IAQ monitor and why.
The Energy Smart IAQ Framework
The best IAQ testers help teach you what matters and fix what matters by measuring what matters.
Good solutions require awareness, understanding, and action. Solution failure can be attributed to a weakness of awareness, understanding, or action. This is the framework I’m going to rank these devices on. Let’s briefly look at the three elements, the devices being tested, then dig into each element.

-
-
Awareness – What’s measured can get managed. The right sensors are needed to measure the most important air quality factors so they can be managed. It may seem obvious but it’s worth mentioning that good calibration is important. The sensors need to be fairly accurate and not prone to wild reading swings.
-
Understanding – The best IAQ testing device needs to have a good mobile and/or web app to help you build informed intuition about your specific situation. You need to see and make sense of patterns. When do peaks and valleys occur? What causes them? Good visualization is key, which means software reigns supreme. A good email tutorial and phone notifications are nice bonuses.
-
Action – Knowledge without action is useless. These sensors ultimately need to drive you to take actions and/or control devices that lower indoor air pollution.
Trying to solve a comfort problem in your home?
The Home Comfort Book will help you avoid wasting thousands chasing symptoms by teaching you what root causes to problems are. The first chapter is available free here:
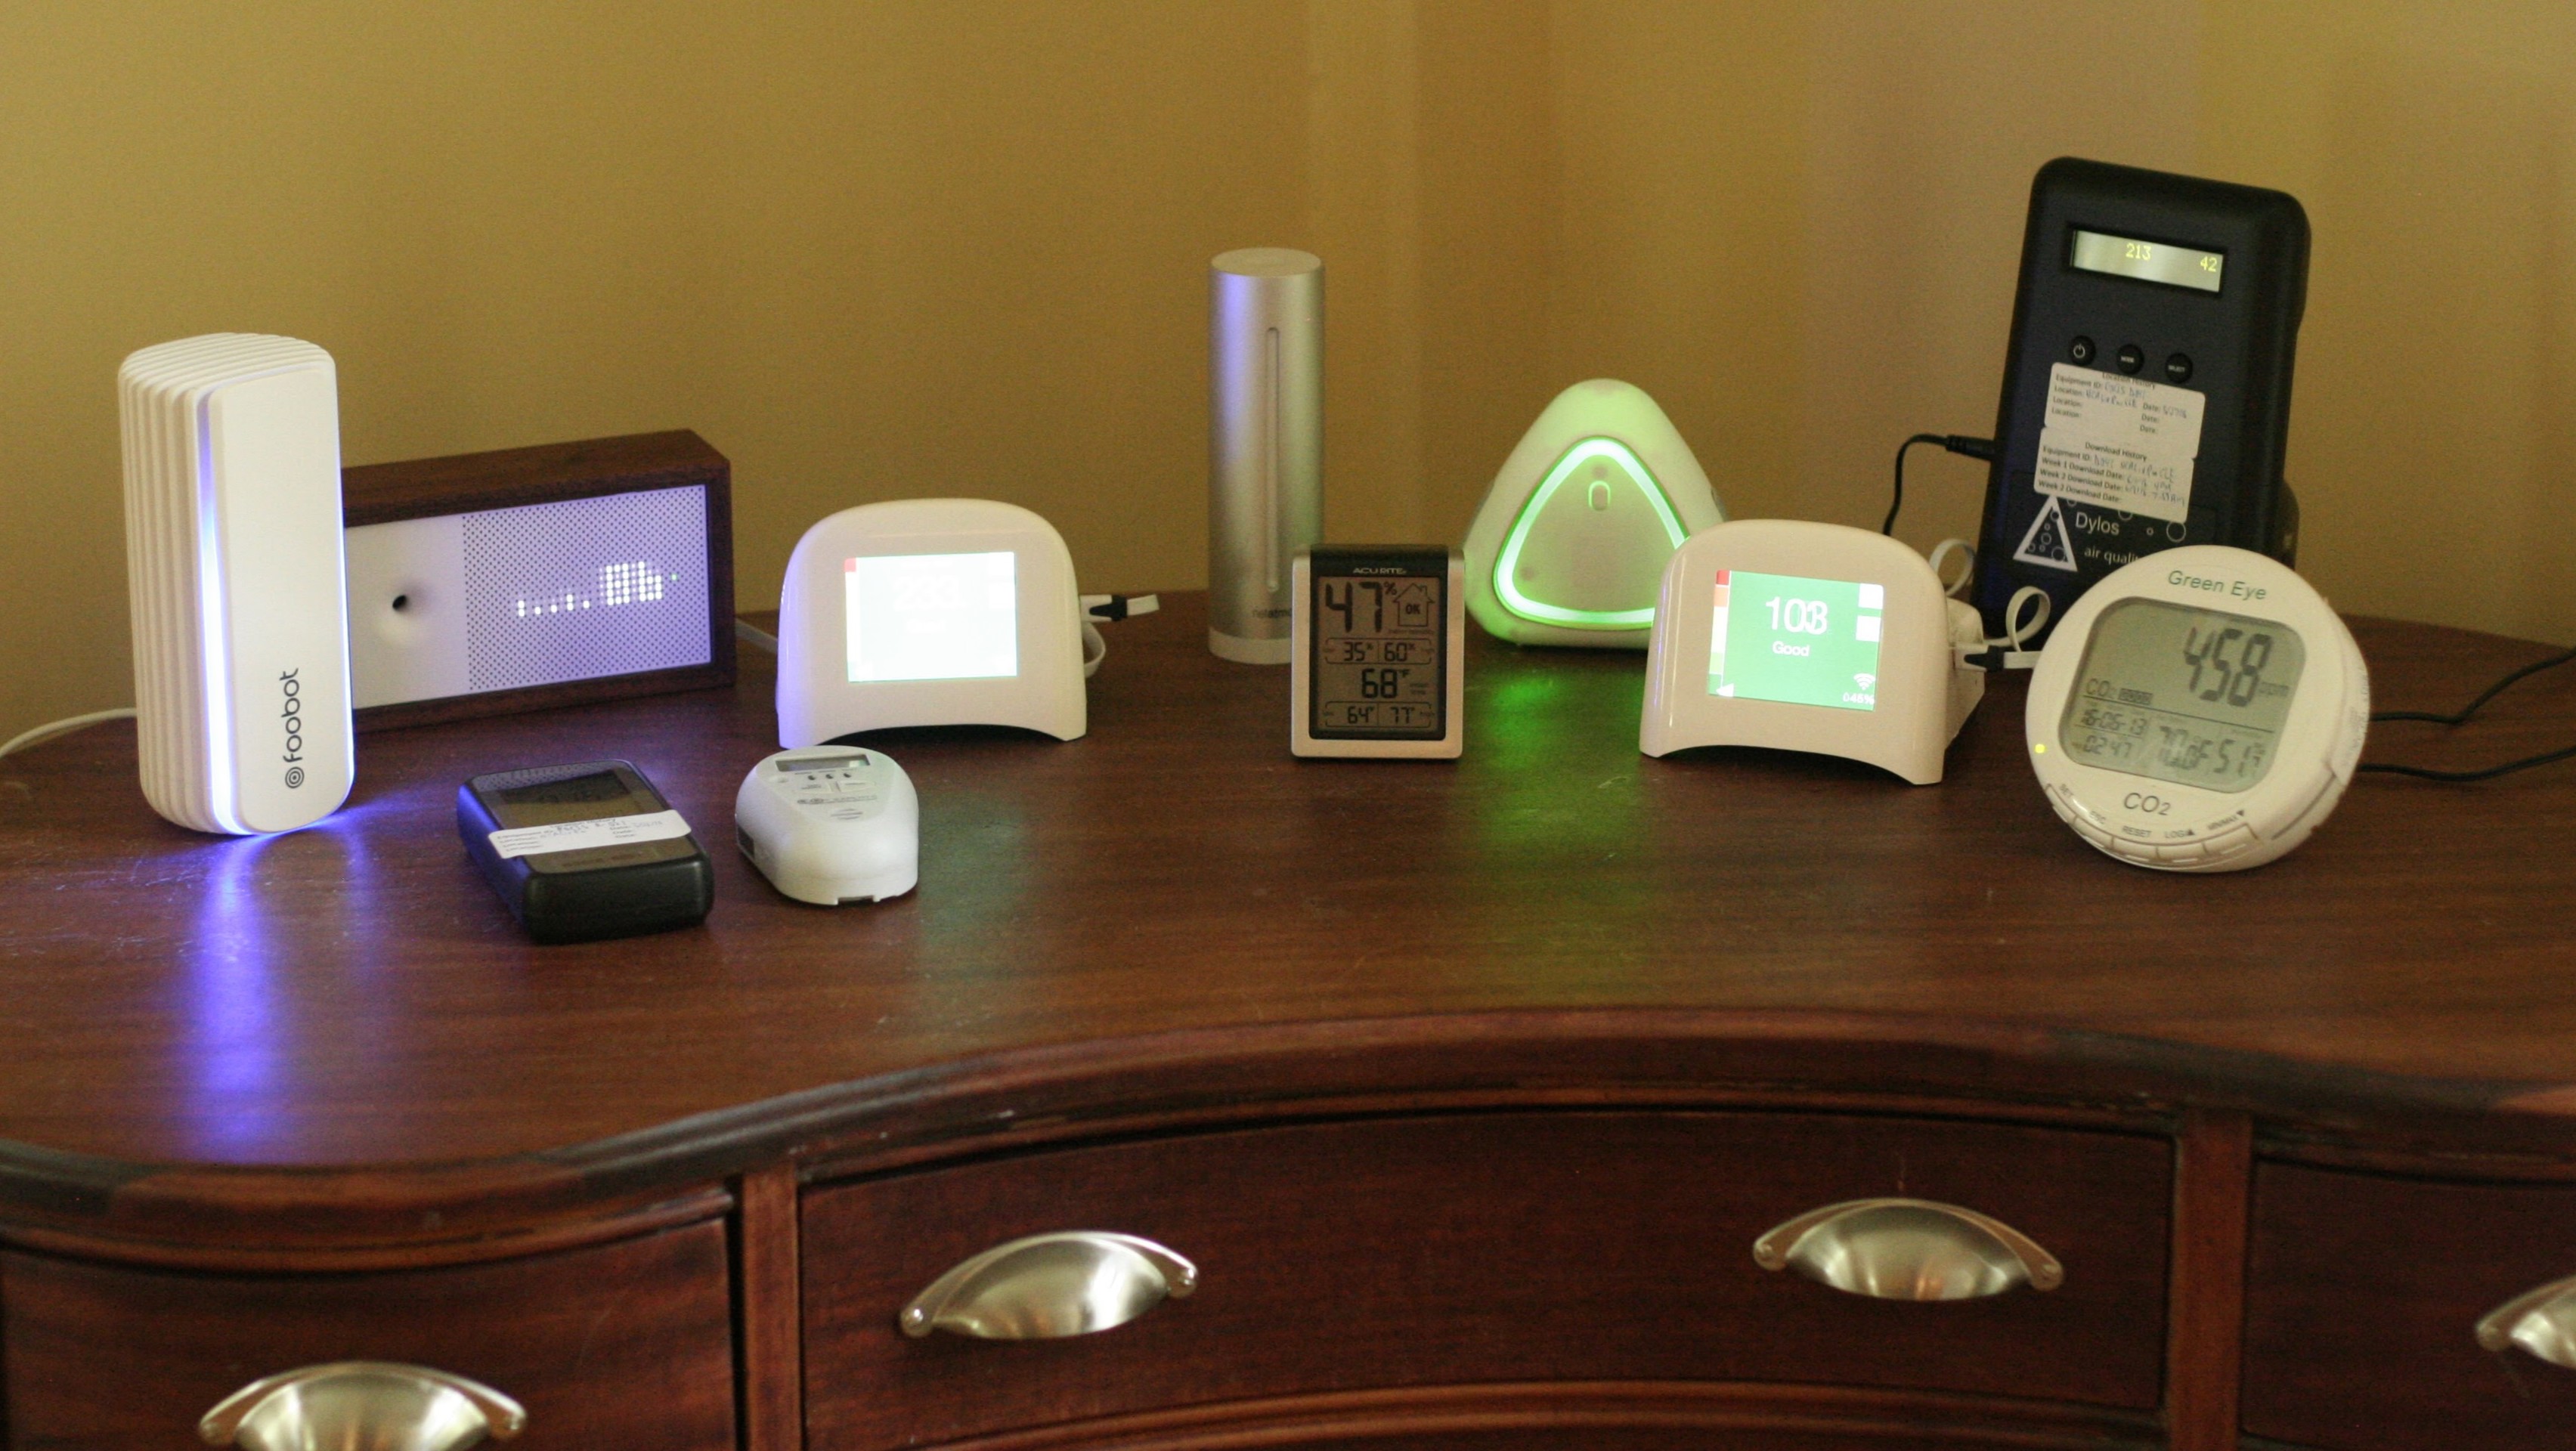
The Players
I limited the review to devices that do datalogging, or measuring and recording data over time. This is a major attribute that distinguishes this new class of IAQ monitors. Without datalogging it’s difficult to understand changes over time. -
Back row left to right:
Foobot – A tall white box with blue lights for good IAQ, orange for poor. Measures PM2.5, VOCs, temperature, and relative humidity.
Awair – A beautiful wood box with 5 bar charts and a numerical reading. Measures PM2.5, VOCs, carbon dioxide (CO2), temperature, and humidity.
Speck – A slightly odd shaped white box with a useful touch screen and a graph of the last hour and 24 hours. Measures PM2.5. On the webapp also temp and humidity.
NetAtMo – A thin metal cylinder, there is a smaller cylinder that is battery powered for outdoors. If you push the button on top it will light up with how good it thinks IAQ is. Measures CO2, temperature, humidity, barometric pressure, and noise in decibels (dB).
Air Mentor 6 in 1– A triangle shaped white box. Slowly flashing light indicates IAQ by color. It measures PM10, PM2.5, VOCs, CO2, temperature, and humidity.
Dylos DC1100 Pro – A black box. It measures PM2.5 and PM0.5 (smaller particles) which are shown on the display. (Technically, it’s actually particles larger than PM2.5 and particles PM0.5 up to PM2.5, thanks to Brett Singer at Lawrence Berkeley Labs for making the distinction.)
Front row left to right:
Corentium Home 223 Radon Gas Detector – Measures radon. Long term, 7 day, and 1 day average. No data logging, so not part of this review.
CO Experts – Not reviewed because of single factor and no datalogging, a good low level carbon monoxide monitor.
AcuRite 00613A1 – A small black box. It measures temperature and humidity monitor – A great starter unit for about $10, but no app or datalogging, so not part of the review.
Speck – A second unit.
Hobo MX1101 – Not pictured. A very small white box. Measures temperature and humidity.

So which attributes of air pollution do we really want to detect? How do we prioritize these things if we have to sacrifice one or more? Here’s my list:
-
PM2.5 – Research is increasingly showing this is a major villain. The recent study about increased mental illness in kids bothers me a great deal. I’m concerned about my 3 year old because I live near a busy road. It’s like smoking, it kills us slowly and causes sensitive individuals varying degrees of discomfort. The WHO said it’s our biggest single environmental health issue, so it’s top of the list. I’d love a sensor that picked up smaller particles like PM0.5 as well. Keep in mind these low cost monitors are in a different class from the high end ones used by government agencies, they are not as precise or accurate.
-
VOCs – Volatile Organic Compounds can cause irritation of eyes, nose, and throat, headaches, nausea, as well as damage to livers, kidneys, and central nervous systems. Some are suspected carcinogens. VOCs look to be the second most important pollutant from the studies I’ve read.
-
Temperature & Humidity – These two are usually covered with one sensor. Damp buildings are causally linked to asthma in kids, humidity and moisture are major health concerns. Contaminants can be affected by both temperature and humidity, so it’s important to have these measured to look for correlations. For example, VOCs offgas much more rapidly at higher humidity levels according to Dr. Richard Corsi of the University of Texas. Another example is that smog formation is often worst on the hottest days. Finally, mold becomes increasingly likely over 60% relative humidity, you want to understand when it happens.
-
Carbon Monoxide (CO) – This common byproduct of combustion replaces oxygen in our blood, causing asphyxiation. Research is showing that low level carbon monoxide poisoning may cause depression, confusion and memory loss. If you have a furnace, gas water heater, gas dryer, gas range, gas fireplace, or any other appliance that burns a fuel in your home, this is something to be aware of. Standard carbon monoxide detectors do not alarm at lower levels. Being an energy auditor, I see problems with CO quite frequently. In fact, my mom was recently poisoned by older furnaces. Particularly in lower income homes, colleagues have told me they’ve seen CO problems in about 50% of homes. I would like to understand carbon monoxide concentrations in client homes over time. Unfortunately, none of the IAQ devices tested has this capability.
-
Carbon Dioxide – CO2 is a good proxy for air freshness in a home. Outdoor levels are around 400 parts per million (ppm). Berkeley Labs found that concentrations as low as 1000 ppm affect cognitive function, and levels in the 2500 ppm range have a substantial effect on decision making abilities. Even so, this is the least important item to measure because tVOC sensors pick it up indirectly and it will likely be controlled along with other pollutants through filtration or circulation.
Would I like more? Of course! Every sensor adds cost, though, these factors are probably enough to figure out how much you should be concerned about your IAQ, and if more steps are necessary.
Sensors & Calibration
I learned through both Foobot CEO Jacques Touillon and Particles Plus CEO (a high end IAQ device manufacturer) Adam Giandomenico that there are only a few sensors of each type on the market. To my knowledge only Dylos manufacturers their own sensors in the devices I looked at. (For instance Foobot, Speck, and Awair all use the same PM2.5 sensor.) Most of these products only integrate sensors into a device, they don’t manufacture the sensors.
Since the sensors in these devices are largely the same, their effectiveness comes down to calibration.
Calibration is comparing what a sensor senses against a known quantity. For example, I grew up around very old cars (1910s-1930s) that had very inaccurate speedometers. This 1911 Mercedes is one example:

To calibrate them, we would take a modern car down the highway next to an old one, match their speeds at an indicated 60 MPH in the modern car, write down what the old car speedometer said, and then go back to the shop and adjust it so 60 was 60. The speedometer was now calibrated.
Calibrating these sensors is a similar process. The sensor readings are compared against a lab standard and adjusted so that the equivalent of 60 MPH is indicated on both the device and the standard. It’s done at more “speeds” than 60, of course. Done well, the sensors are calibrated before shipment and also as the sensors age using software calibration.
Foobot is the most interesting device for calibration. While it does give readings immediately after being turned on, it says it’s calibrating itself for the first 6 days and adjusting to its environment. At first I found it annoying, but after further thought the device gets more respect from me.
This leads us to our first comparison between the devices. Fair warning, I’m not a data scientist, so these are definitely anecdotal. Further complicating things is the fact each IAQ monitor has a different combination of sensors. It is difficult to truly compare apples to apples. Here’s my attempt:
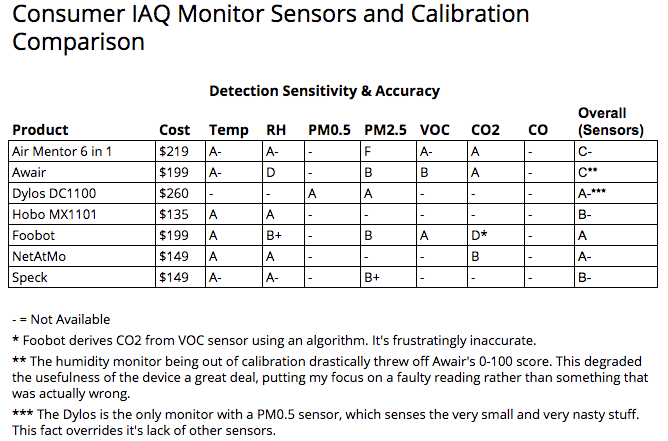
Results – Awareness
The Dylos, Foobot, and NetAtMo come out on top. Dylos and NetAtMo do it primarily with novelty. Dylos is the only laser particle sensor and the only one that measures down to the very small and very dangerous PM0.5, as the low range measures 0.5-2.5 microns. NetAtMo is a weather station with both indoor and outdoor units, the only IAQ monitor with this capability. The indoor unit also measures carbon dioxide. In my mind having on-site readings of outdoor conditions (temp and humidity) helps this device hit above its weight class. Foobot slugs it out by having what I view as the best sensor array and calibration, save the very mediocre CO2 readings. The CO2 readings don’t seem to affect Foobot’s “Global Index”, or 0-100 score, so it gets a pass on this peccadillo. There are plans to update the faulty algorithm as well.

Good readings don’t mean a thing if you don’t know how to interpret them. This is where software is king. Good software accomplishes a number of things:
-
Good and Bad – A good device informs intuitively what a good or bad reading is. What are the thresholds?
-
Onboarding – Teaches you how the device and software works, preferably in small bites.
-
Good Apps – Intuitive app and/or webapp for analysis.
-
Wifi Connection – This may seem obvious, but several devices only have a BlueTooth connection. One needs a cable. This is the internet of things, people. Get your things on the internet.
-
Visual Cues – With a glance at the device you should intuitively have an idea of how your air quality is at that moment, without having to open the app.
-
Behavior – Logging and asking for tags helps you understand what behaviors are causing spikes, i.e. cooking or cleaning or rush hour traffic or high humidity.
-
In & Out – Help you understand the relationship and difference between indoor and outdoor environments. For example, when is it ok to open windows? When is it better to keep them closed and turn on the AC?
-
Trends – Helps you understand trends over days, weeks, months, and even years. Summer and winter will likely be different for IAQ, tracking over time helps you understand this.
-
Do I Need to Act? – ‘Nuff said.
-
Planning – What factors are a problem in your home so you can begin to formulate a plan to solve them.
If an air pollution detector has all of these attributes, it should be useful to homeowners (and pros) trying to diagnose Indoor Air Quality problems in their home. Done well, homeowners should have a pretty good understanding of what factors need a solution and maybe what to try first. The device may even suggest contacting a building science pro.
For pros like myself, there are a few more things that I’d like to see:
-
Advanced Visualization – An upgraded webapp that let’s me slice and dice the timeframes and readings. This is important for helping figure out what’s going on in a client home.
-
Diagnostics Usefulness – Enough well calibrated sensors to help diagnose problems rather than leave me scratching my head and looking for more data.
-
Comparing Multiple Monitors – I like to place multiple monitors in client homes, one on each floor and one outside if possible. That way I can watch for weird patterns and also splits in temperature. If the second floor is much hotter than the first in summer, there is a problem that needs to be diagnosed and solved.
-
Easy Access to Multiple Clients – I don’t want to mess around with multiple logins. Having to save and access more than one username and password for any site is a pain in the neck. I want to be able to access multiple clients with just a few clicks.
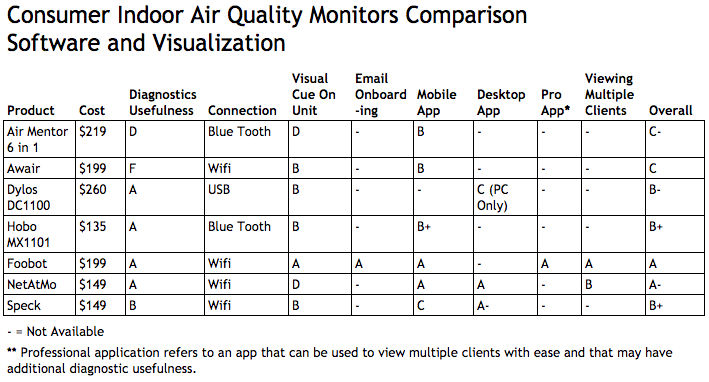
So, how do I feel the devices stack up on Software and Visualization? Here’s my comparison:
Update: Awair is rolling out a dashboard, but I still have concerns about its calibration.
Results – Understanding
Basically, the Foobot cleans up. It simply doesn’t have a weakness in this aspect aside from no consumer desktop app. The mobile app is useful, it sends notifications of pollutant spikes, the simple visual cue of blue/orange lights is fabulous, the email onboarding is good, and Foobot has the only app for pros. Foobot could use the ability to zoom in and out on the timeframe like NetAtMo.
NetAtMo has good mobile and web apps. Mixed with the indoor and outdoor sensors, it’s a fairly useful tool for finding out if your house needs fresh air ventilation or if humidity is too high or low. (High/low humidity can cause all sorts of issues.) It also allows you to zoom in and out on the timeframe to look for spikes while showing one month on the timeframe, but zoom in to see exactly what hour or minute the spike peaked. For example this is often with carbon dioxide this is 3-5 AM from sleeping in the bedroom.
The little Hobo MX1101 is the surprise here. While it only measures temperature and humidity; it’s small size, battery power, and four magnets let you put it on metal in out of the way places like an attic or inside a duct. You can then read out from it by getting close to the device with your phone using BlueTooth. The app is quite nice. It’s the underdog that has it’s day.
For more details on pros and cons of each IAQ monitor, download the free comparison PDF at the end of the article.

OK. You know there’s an Indoor Air Quality problem in your home, and you’ve been measuring with one of these devices. Now what the heck do you do? A device falls down here if it has made you aware of a problem but has no path to helping you solve it.
As Teddy Roosevelt famously said “Complaining without proposing a solution is called whining.” You don’t want a whiner, you want a solution!
A product that really helps deliver a solution to IAQ problems will have at least these attributes:
-
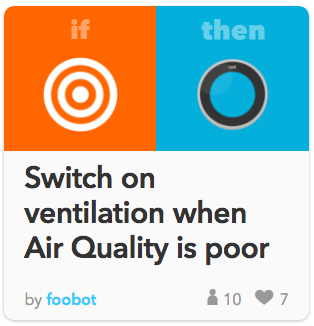
IFTTT Integration – If you’re a gadget freak and haven’t heard of If This Then That, check out ifttt.com. It lets you connect all sorts of different things. For example, Foobot can connect to a Wemo switch (which lets you turn a plug on and off with an app). Now when Foobot senses high pollution, it can switch on whatever device is plugged into the Wemo switch. You can also use IFTTT to connect Foobot to Google Docs and have it automatically create a spreadsheet of readings for you to analyze later. Geeky, but potentially very powerful.
-
Thermostat Integration
-
Turn on Furnace Fan – While spot solutions like filtration are important, many times the solution is going to be in turning on your forced air HVAC system (furnace, heat pump, and/or air conditioner) to run your home’s air through the whole house filter. (This is NOT a panacea, though, often the house will need upgrades to deal with root causes.)
-
Turn On Fresh Air System – Also known as mechanical ventilation systems, these bring filtered and conditioned outdoor air into your house.
-
Turn On Humidifier/Dehumidifier – Controlling moisture levels inside the house is very important for health and comfort.
-
Nest, Ecobee, LuxGeo Thermostats (and More) – The previous three items are only possible if an IAQ device can connect with a thermostat or other HVAC control to tell it to turn on as needed. Foobot already has integration with the LuxGeo and Nest thermostats.
-
-
IoT Integration – The Internet of Things is getting to the shakeout phase. Just like VHS and BetaMax duked it out for the video market in the 80s, there are numerous competing IoT standards, such as Amazon’s Alexa. Foobot just become Alexa compliant. As winners emerge, IAQ Monitors are going to need to be able to snap into these standards and be able to control various devices within an IoT connected home. IFTTT is unlikely to be enough.
Update: Foobot and Awair are both compatible with most other IOT systems – Google Home, Amazon Alexa, thermostats like Ecobee, Nest, and Lux.
Results – Action
Three products have the capability for action. Foobot, Awair and NetAtMo.
Foobot has several recipes on IFTTT and a connection with the LuxGeo and Nest thermostats. Through IFTTT it can control a Nest. Being familiar with this company, I know that much more is planned.
NetAtMo has its own thermostat. This is pretty good, but limiting. What if you already have a Nest, Ecobee, or other thermostat? Also, NetAtMo doesn’t measure PM2.5 or VOCs. That means it can’t turn devices on if levels of those pollutants are elevated.
Awair seems to have the same capabilities as Foobot.
Bringing It All Together

So, when we bring together the device ratings for Awareness, Understanding, and Action, how do they score?
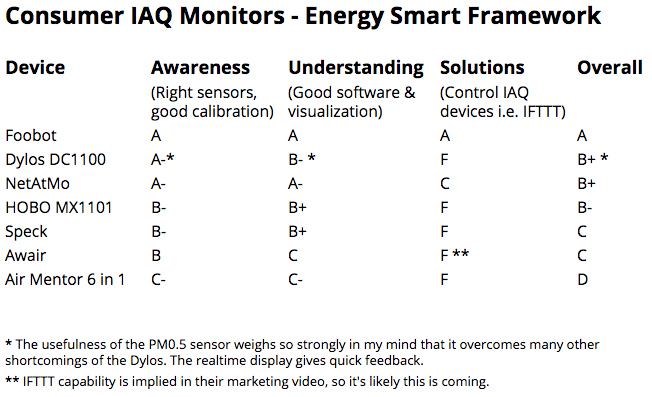
Overall Winner – Awareness, Understanding and Action

Foobot has many strengths and few weaknesses. While there are areas we’d like to see improved, it simply doesn’t have a weakness large enough to get beaten by the other IAQ monitors. It’s the only one that performs really well in my Awareness > Understanding > Action framework.
Is it perfect? Heck no:
– The carbon dioxide measurements are annoying and overstated.
– There isn’t a consumer webapp (although the professional one could likely be adapted.)
– No ability to zoom in and out of timeframe to find spikes and see what time they occurred. (This is possible in the professional dashboard though.)
– I would love to have direct outdoor temperature and humidity readings to look for correlations. (A second Foobot in a protected space like a porch can do this.) It does use regional air quality data from Breezometer.
– I would also like for it to have PM0.5 and carbon monoxide detection.
Aside from those objections, it’s head and shoulders above the competition. I plan to write a full review on it.
Runners Up

The Dylos DC1100 Pro is the only device that senses down to the very small particulate matter class of 0.5 microns (PM0.5). PM measurement is so crucial in Asia people check PM apps more than they check the weather. PM 0.5 are the worst of the worst, the particulates that are most likely to cause health problems because many of them go directly into your bloodstream. If measuring PM is important to you, this is the device to own. Be sure to look for the “Pro” model. The regular model only monitors PM2.5.
UX Weaknesses – This device has no wireless connections and only a PC based program for downloading and analyzing data. The PM0.5 capability at only $260 overrides my other objections. If you have a scientific bent, this is a good device to consider, although probably in addition to a Foobot rather than in place of it.
I’ve been borrowing 3 Dylos meters from my friend Linda Wigington as part of a study on low cost particulate meters called ROCIS. I plan to buy one after giving them back.

Outdoor sensors will become increasingly important. NetAtMo is the only IAQ device that has both an indoor and an outdoor sensor. Additional sensors can easily be added. The app and webapp for NetAtMo is quite good, and you can easily let others see what’s going on in your home with a few clicks. If you like weather stations and want to upgrade, try one of these.
In helping clients solve problems in their homes, I like to have an understanding of what’s going on both inside and outside their home. How quickly does heat or moisture seep in or out? When are conditions indoors uncomfortable? With NetAtMo I can work on something more than anecdotes from clients, I have hard data. The diagnosis will likely be better.
Conclusion
I have a lot of hope that this new class of consumer air pollution monitors can help us make our homes healthier by taking the invisible pollutants and making them visible, then letting us know if our attempts to improve IAQ were successful. The next few years will be very interesting as this market matures. In time I hope that more products will fit the Awareness > Understanding > Action framework.
Want more details on the specific devices? Download the free Pros and Cons chart of these devices. Plus you’ll get a free copy of the Indoor Air Quality chapter of The Home Performance Book when it comes out!
Free IAQ Monitor Pros & Cons Guide
Enter your email to get more details on the individual IAQ monitors. You’ll get the free Indoor Air Quality chapter of our book when it comes out too!
Thinking of Buying an IAQ Monitor?
If you found this article helpful and plan to buy one of the devices reviewed, would you be so kind as to buy one with the following links? They’re the same price you can buy them elsewhere and I get a commission. I don’t get paid for this research, and I have hundreds of hours and dollars into creating this article. Buying from here will help me keep the bills paid so I can keep writing about IAQ. Thanks in advance!
Resources
Update: Initial Berkeley Labs Consumer IAQ Testing by Brett Singer – Brett did what I would have loved to do. They set up very high end monitors (up to $35K each) and created “events” like burning toast, then watched how the consumer grade monitors reacted. This is initial research, not final, but Foobot and Purple Air did the best of the ones tested. This is their presentation from the 2017 Energy and Environmental Building Association conference, see pages 27-45.
Album of Indoor Air Quality Monitor Pictures – I’ve been recording my journey in pictures and with screen shots of each device, along with comparisons and notes about spikes I’ve seen while trying to decide which ones I trust.
Porch Paint and VOCs – My first IAQ monitor article about how different monitors reacted when we painted our front porch.
7 Million Premature Deaths Annually Linked to Air Pollution – World Health Organization – 1 in 8 deaths is linked to air pollution. A 2014 report.
More than 80% of people living in urban areas that monitor air pollution are exposed to air quality levels that exceed WHO limits. – World Health Organization 2016
State of the Air – American Lung Association – A ranking of cities by ozone levels, average PM2.5 particulate levels, and peak PM2.5 particulate levels. See where your city stacks up. (Cleveland, where I live, is usually around #10 worst for average particulate levels.)
Air Quality Index – Wikipedia – A history and explanation of AQI. The metrics on levels are good to see, too. There aren’t a lot of standards on pollutant levels.
VOCs at EPA – A good introductory article on Volatile Organic Compounds.
Ultrafine Particles – Wikipedia – These are PM0.1 and smaller. They are particularly nasty. Many go straight to our bloodstream. They have been noted to raise blood pressure in school children. Many are created from burning fuels. (Consumer level devices can’t measure these directly yet, Dylos comes close with it’s PM0.5 detection.)
Your Office Air Is Killing You – Newsweek – How a Speck particulate matter monitor discovered a school was sucking in diesel fumes. Also a good overview of IAQ.
WHO Outdoor Air Pollution Database – For geeking out.
Trying to solve a comfort problem in your home?
The Home Comfort Book will help you avoid wasting thousands chasing symptoms by teaching you what root causes to problems are. The first chapter is available free here:
Popular Post
Highlighted Posts